Create Reports Based on Collected VCA Data
The information gathered by a video management system is now far beyond being simply a bunch of recorded video streams. We collect oodles of data from VCA, POS, OPC, access control and other systems; but simply having these data is not enough. We want to be able to analyze what is happening, preferably on the fly, and react to it so that the most important information is quantitative, enabling us to run all sorts of queries on it afterward.
In this regard, various counters inside the video management system are our best friends. A counter is an entity that contains some value, which can be incremented or decremented, reset to zero, or simply assigned a specified value based on some event. In video contents analysis (VCA), counters are extensively used for storing the information about how many times a particular VCA rule has been triggered.
Luxriot EVO software suite provides you with powerful reporting tools. Aimed primarily at handling data received from the VCA module, these also support embedded software counters, which, in their turn, may be based on data from various external modules, such as POS terminals or access control systems.
The reporting functionality is already included with Luxriot EVO S and EVO Global products. All reports are based on the counters' data, which can be received in several ways:
- from integrated Open Video Content Analysis (Open VCA) module: works for any video stream
- from edge (onboard) VCA: for supported manufacturers
- from internal software counters, which can count virtually anything
How is This Useful?
While both server-side and camera-side VCA counters provide statistics on the triggered VCA rules – typically, people or another object counting, – software counters can be assigned to any events that exist on the server. These can be events from third-party modules – license plate recognition, facial recognition, OPC servers, access control software, POS systems, and others. So, you can have reports on how frequently a gate or a door is opened, which beer is the top one bestseller on weekends, how many times per month a particular person visits the restricted area or even who of your employees is late for work most often. And on many, many more use cases, of course, in many different areas, including security, public transportation, retail, healthcare and traffic analysis.
In this article, we shall take a look at a narrows application of this functionality – retail analytics. Count people on entrances, know how many shoppers are in a particular area, analyze queue length in order to reduce the customer waiting time, discover the busiest times and locations in your store – this is only a short list of benefits for the retail world when you know how to utilize your data.
Prerequisites
A preliminary setup is necessary in order to obtain the data to run the reports on. Depending on the kind of counters you are going to employ in a particular case, you may want to use:
- camera-side VCA as a source:
- find a camera with onboard analytics and make sure we support VCA events from it
- activate, calibrate and configure VCA on the camera side (vendor-specific), make sure to include counters for the things you require to be considered
- set up the camera in EVO and enable video and VCA data recording
- software-side VCA as a source:
- activate VCA on your Luxriot EVO server
- enable VCA on the target video channel from the same server
- calibrate and configure VCA for that particular video channel as desired
- turn ON recording of video and VCA data
- software counters as a source:
- set up internal or external events that you wish to account for
- create software counters and assign them to these events
Data received from different sources and multiple channels can be combined when making a single report. The numerical data from all counters are bound to the recorded video streams, so, on one hand, this guarantees data accuracy, and, on the other hand, stipulates that the data used for creating the report are received within the same time period.
Manual Reporting
This reporting option, available in the Luxriot EVO Monitor application, provides you with an opportunity to combine counters from different sources for comparison. So, you can connect to your server – or servers – from literally anywhere in the world in order to create a custom report, which can be adjusted as many times as required, and then exported into a PDF file. The feature is available automatically if at least one of the connected servers has some counters' data available: all counters will be then listed in the Reports tab, with their source channel names indicated next to them.
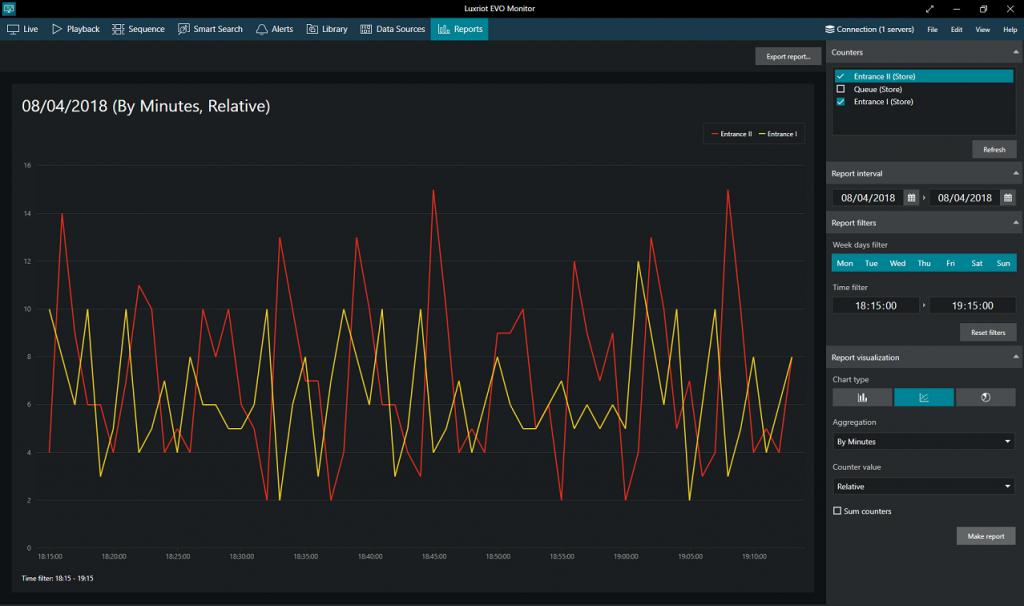
Let us compare the customer flow from two store entrances over the past hour:
- mark counters Entrance I and Entrance II to be used for creating the report, then
- set the report interval to today,
- select the time of interest under report filters,
- next, choose line chart as the report visualization (graph) type,
- aggregation will be set to minutes automatically as it is the most appropriate step for the chosen time,
- finally, the counter value should be set to relative as we want to see how many customers entered each minute.
Hit the Make report button and the result will be displayed in the main window section. Voilà!

Now, to modify this query so that the report displays the customer flow intensity not just for the past hour, but for the same hour every day for the past week:
- change the report interval to the past week,
- set aggregation to hours, as minutes would be too small for a unit to be displayed on this new, larger graph,
- also, it would make sense to switch to the bar graph type as it is more informative for this new report purpose.
Should you want the report to include working days only:
- simply unmark Saturday and Sunday in the weekdays' filter under report filters and run the report again.
Remember that closing the EVO Monitor application will blank your report settings, so use the Export report button to save the graph as a PDF file.
Automatic Reporting
Should you need to create regular reports with identical settings, EVO server can do it for you automatically and then email you with the ready-made PDF. You can pre-configure daily, weekly and monthly reports to be sent to you right after the interval of interest has ended – for instance, the daily report will be sent to you right after the clock strikes midnight.
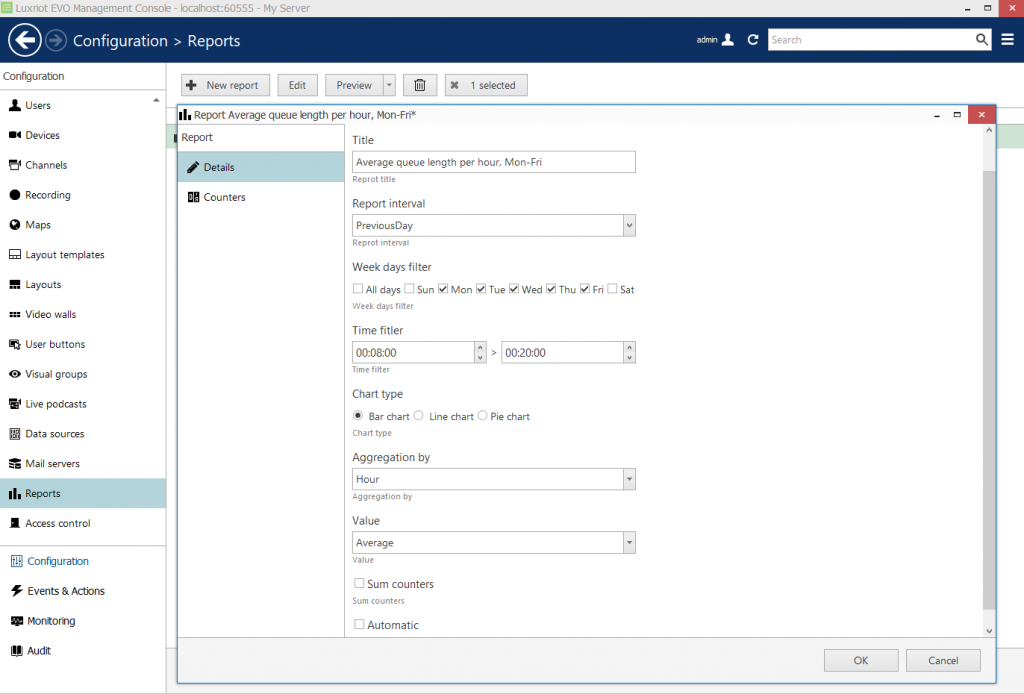
Let us configure a daily report with per-hour average of the queue length.
The report settings are mostly the same; in addition, it is necessary to:
- specify the report interval - instead of a calendar with custom intervals there is a fixed choice between previous day, week or month,
- mark the Automatic option, then
- choose the mail server that will be used to send the report,
- and, of course, add a recipient email for the report to be sent to.
If you have no mail servers to choose from (meaning you have not listed any so far), you can add one right on this step.

Switch to the second tab, Counters, and mark the necessary counters – in this example, that would be Queue. And, finally, save the configuration. There is a Preview button above the report list: click it to have EVO build a test report for you to make sure it produces the exact desired result.
Now, you can go and create any number of reports based on your collected VCA data and send them to right people :)


